BAT Tools
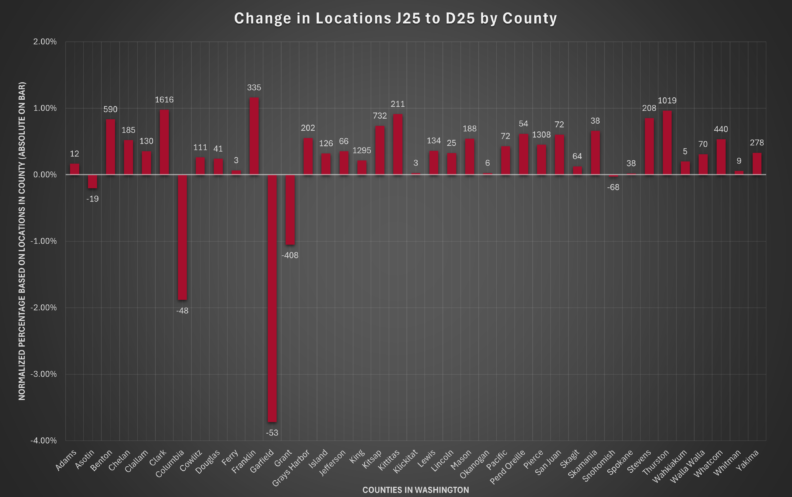
Outcome of initial analysis of the changes between version 7 and version 8 of the National Broadband Map. This chart shows the absolute change in locations at the ends of the bars. Additionally, the bars represent the relative change normalized by the number of locations in the county. Please click on the image for a larger view.
This analysis shows both 1-Year and 5 Year graphs data from the American Community Survey. In addition, there is a line labeled as Washington that shows the whole state estimated data.

This is a map showing what technology won in an area throughout Washington. Unfortunately, while the locations are known you have to have a data license to display the content at a specific location. The regions shown list the number of broadband serviceable locations in them and what technology won.
This is a map showing the awardees project areas for the State of Washington. If you hover over an applicant a button will appear allowing you to filter to one applicant.
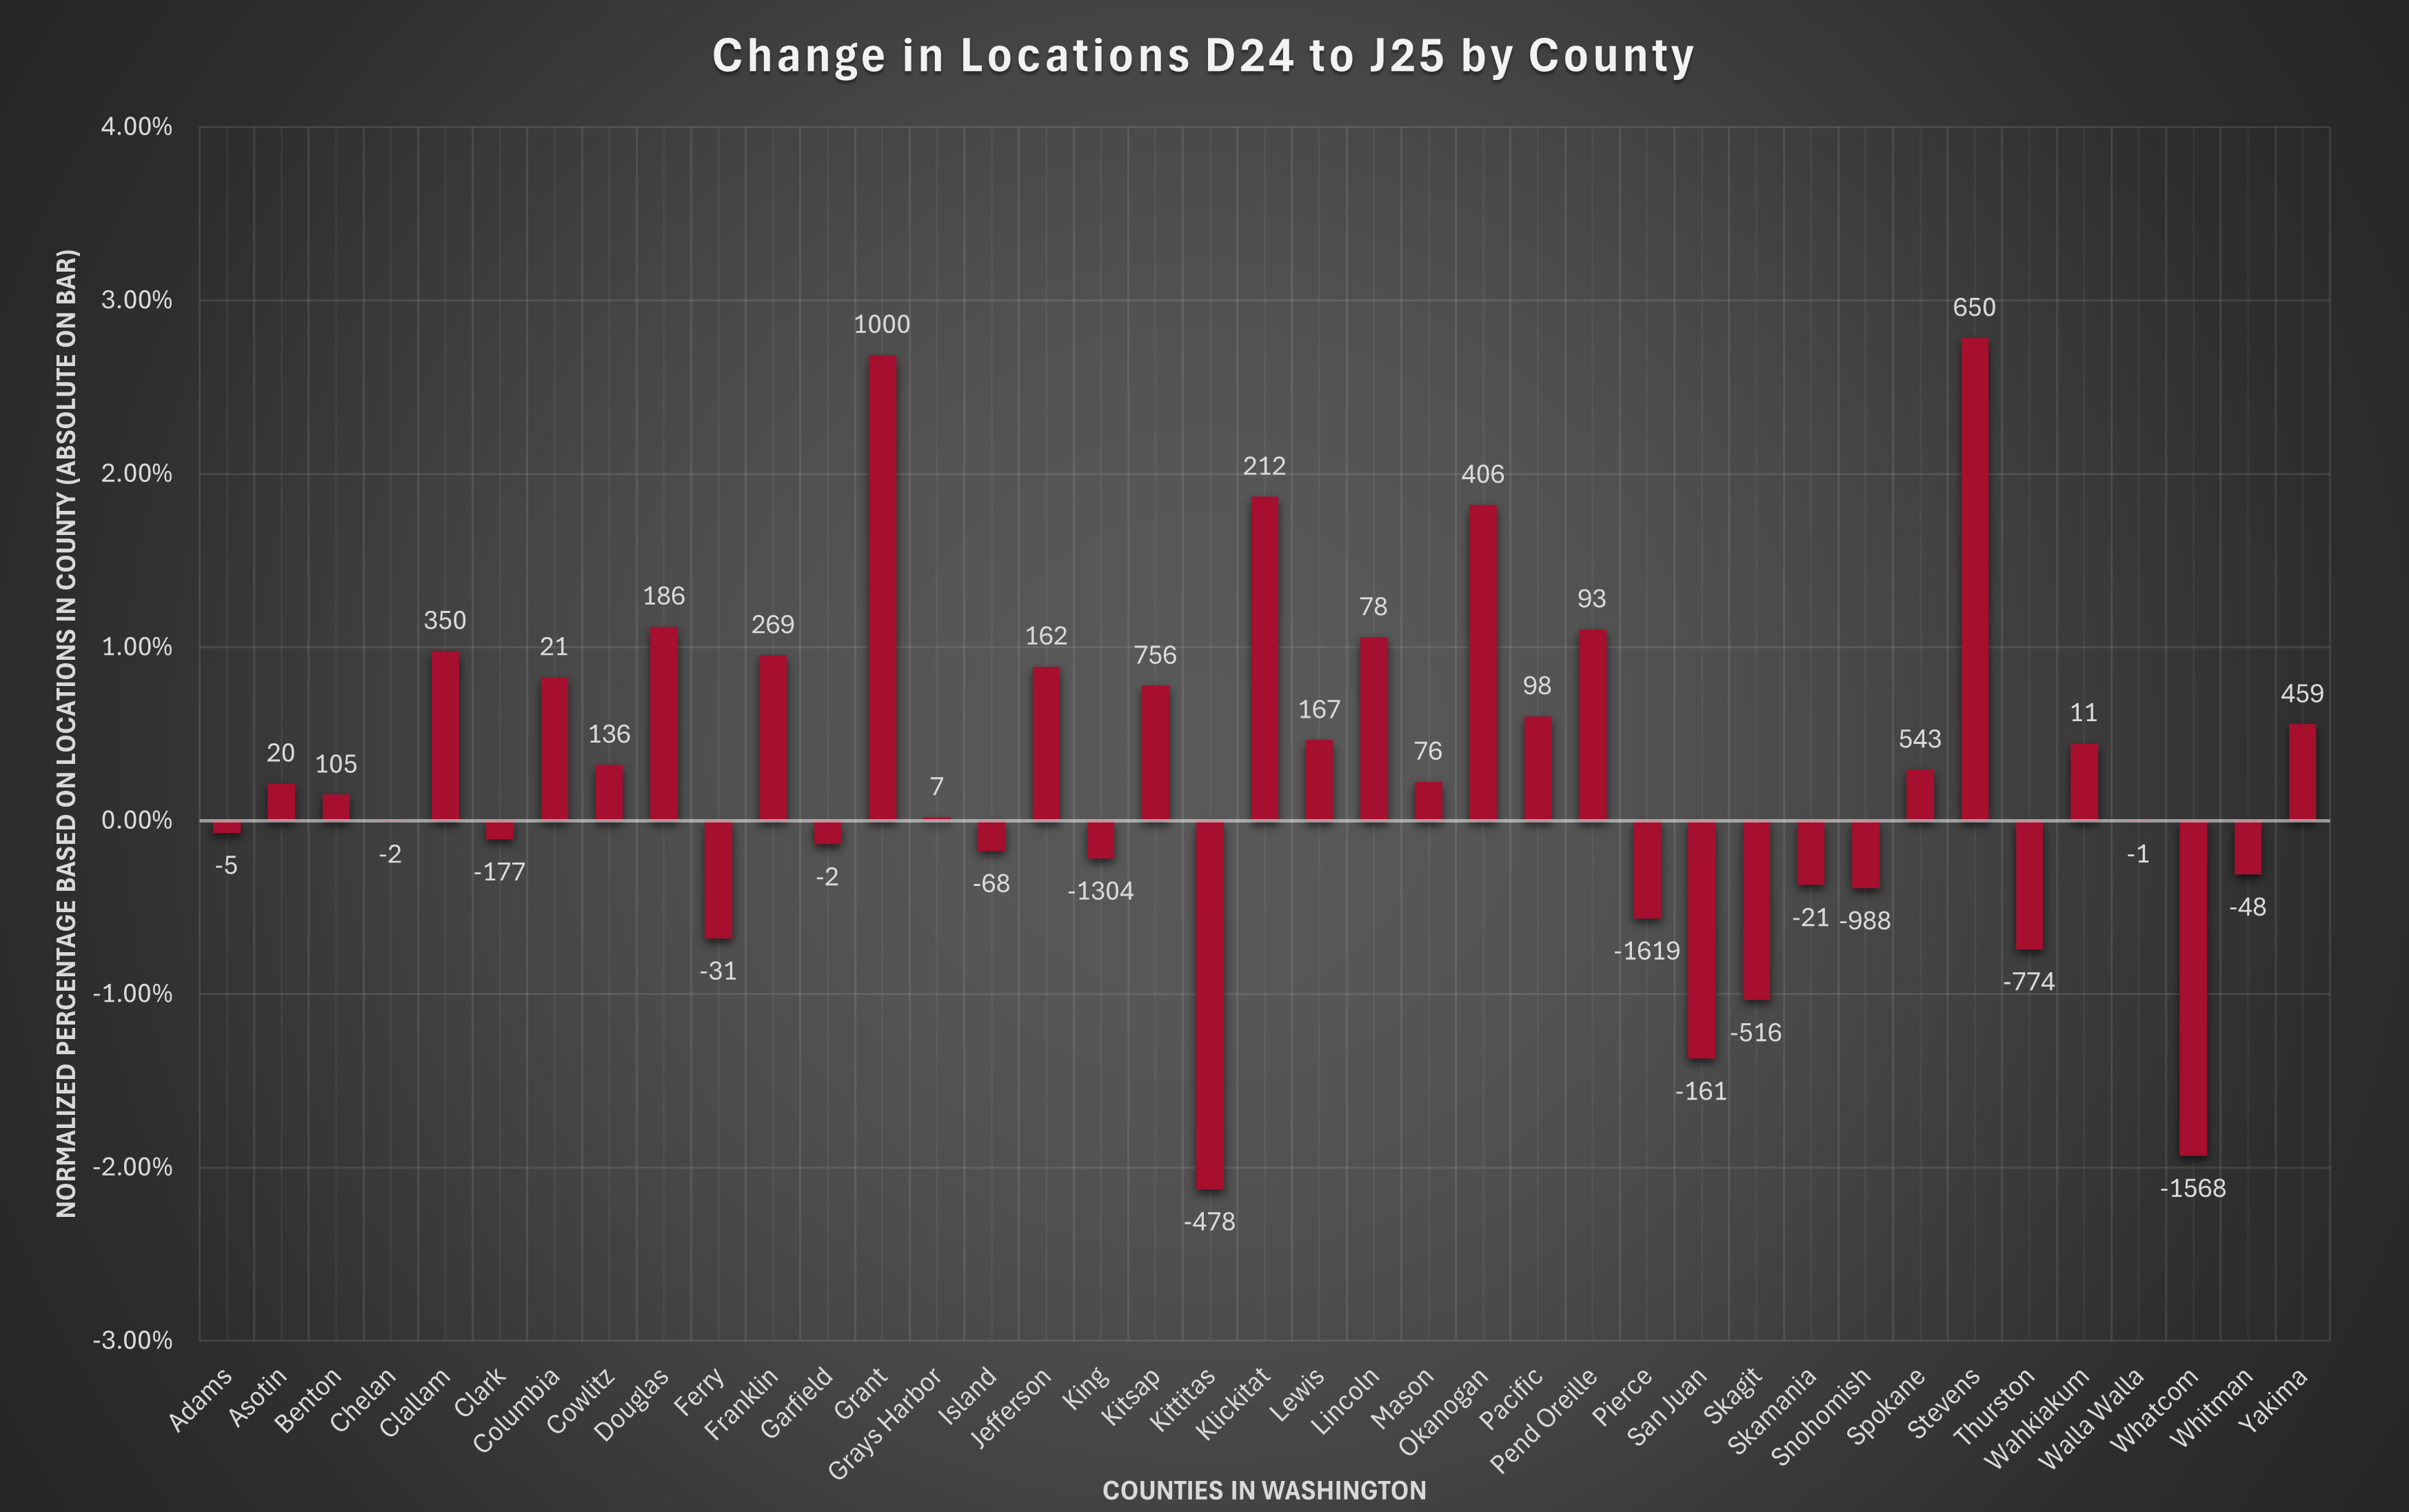
Outcome of initial analysis of the changes between version 6 and version 7 of the National Broadband Map. This chart shows the absolute change in locations at the ends of the bars. Additionally, the bars represent the relative change normalized by the number of locations in the county. Please click on the image for a larger view.
This is an archive of the BDC data for Washington from January 23, 2024 that is being used in the BEAD challenge process.
NOTE: There are two files. The first includes all technologies except for Geostationary Satellite services. The second file is the GSO services.
BEAD Challenge Availability Data
Geostationary Orbit Service Data
This data was retrieved from the personal archives of Robert Martin.
This is a map of all of the funded polygons for Washington that the FCC is using for the National Broadband Funding Map. This data was retrieved on March 13, 2024 and is from a release dated March 11, 2024.
This map was built from the NTIA High Cost Census Blocks found here.
This is a tool that analyzes ACP data from USAC and Eligibility data from Education Super Highway to provide a picture of how ACP enrollment is progressing in Washington.
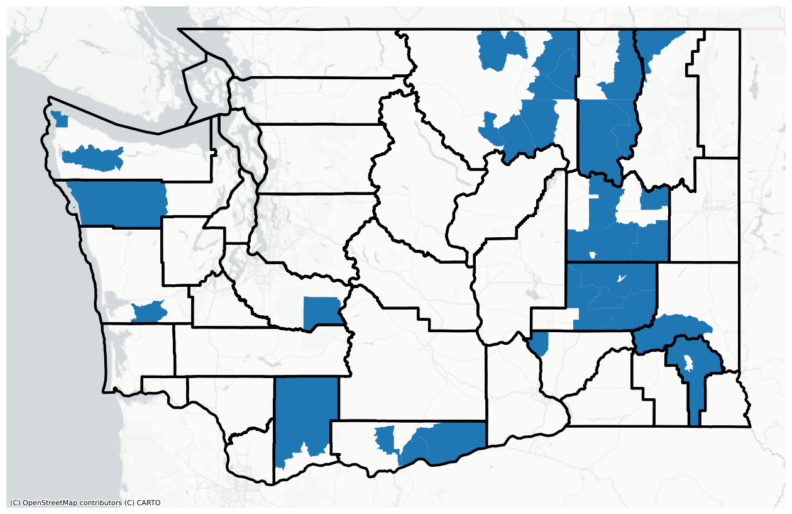
In Washington there are areas where there is only Licensed Fixed Wireless service available to BSLs. This analysis identifies those areas and builds maps to show where investments may be locked out of being made due to lack of ability to receive funding.
Interactive County Maps (Examples: Kitsap, Spokane)
Static County Maps showing BSLs Served by only Licensed Fixed Wireless:
Maps of the CAI points and Un/Underserved tiles with BSL counts.
A list of presentations that we have made to help understand the broadband space.
A repository of all of the Community Action Plans from the WSBO Broadband and Digital Equity Planning process in 2022-23. WSBO plan repository: Link